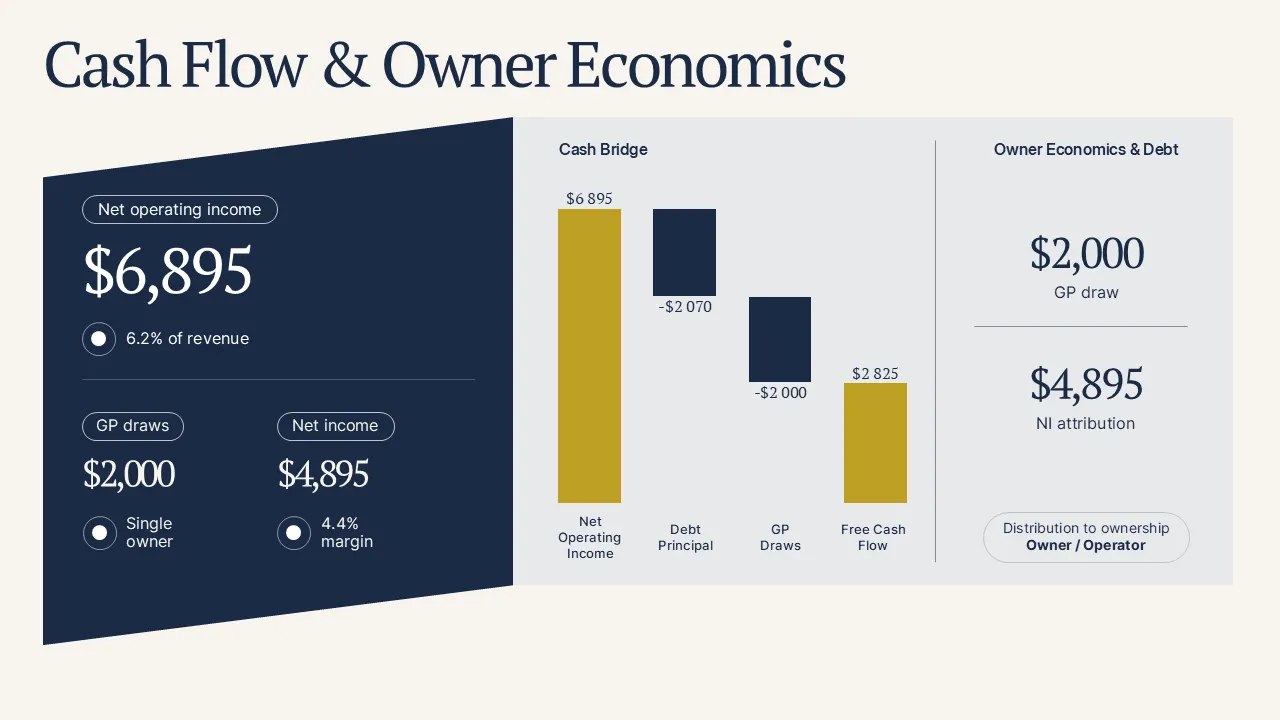
 3 shots
Presentation DesignFeatured
Analytics dashboard slide collection
4 dashboard slides
Goal: present operational analytics to non-finance stakeholders without wall-of-numbers fatigue.
PowerPointDashboard slides
See the slidesWork
Filter by craft. Every case opens on its own page with visuals, method, and outcomes.
Showing all 15 cases.
3 shotsPresentation DesignFeatured
4 dashboard slides
Goal: present operational analytics to non-finance stakeholders without wall-of-numbers fatigue.
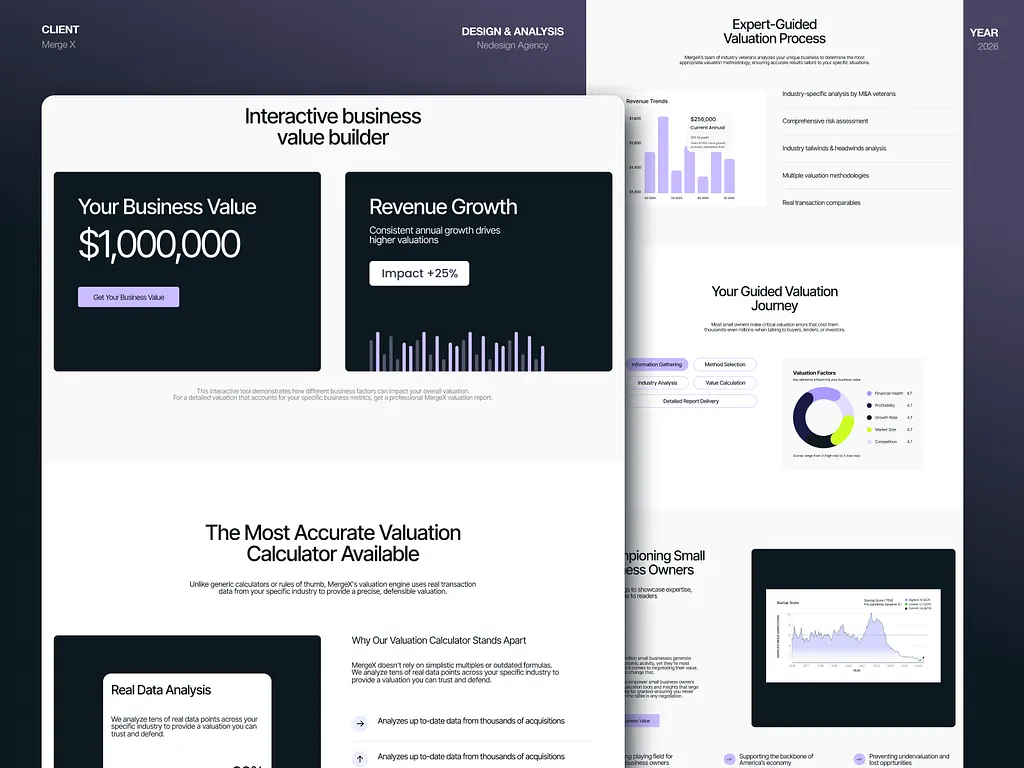 2 shots
Business Analysis
Valuation flow plus market views
Goal: help owners understand what drives their valuation and what to do next.
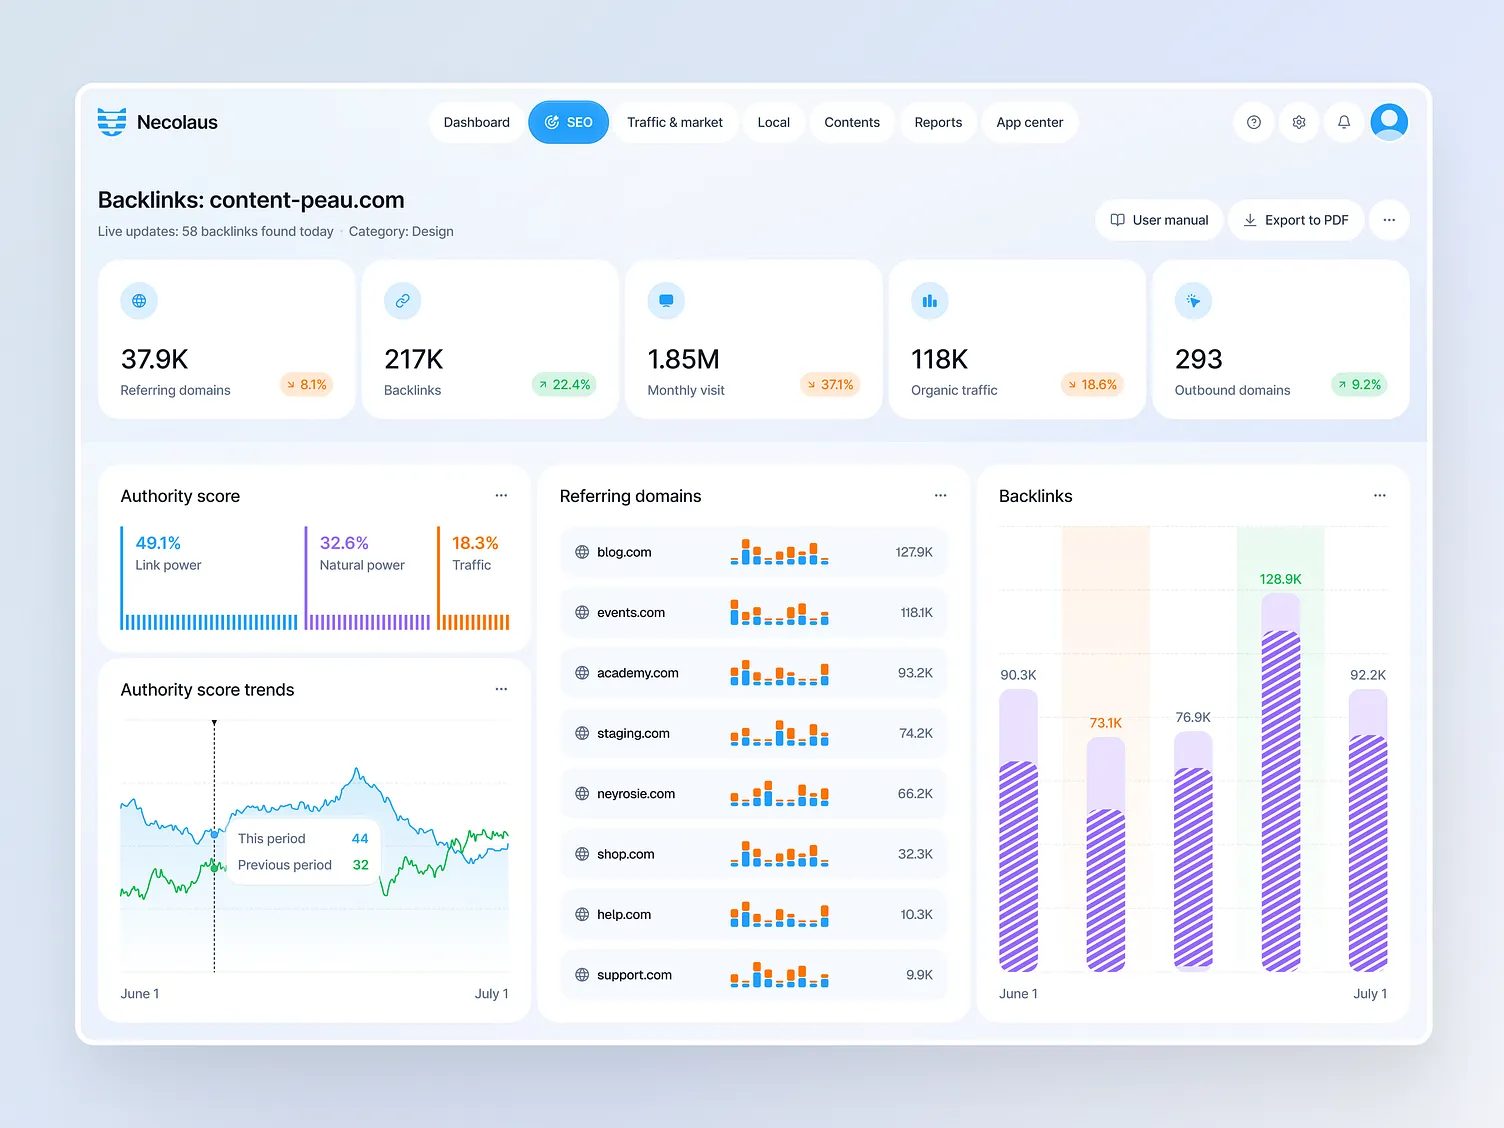 4 shots
SEO & Content
Backlinks plus rankings plus GBP
Goal: grow referring domains, hold local rankings, and convert profile views.
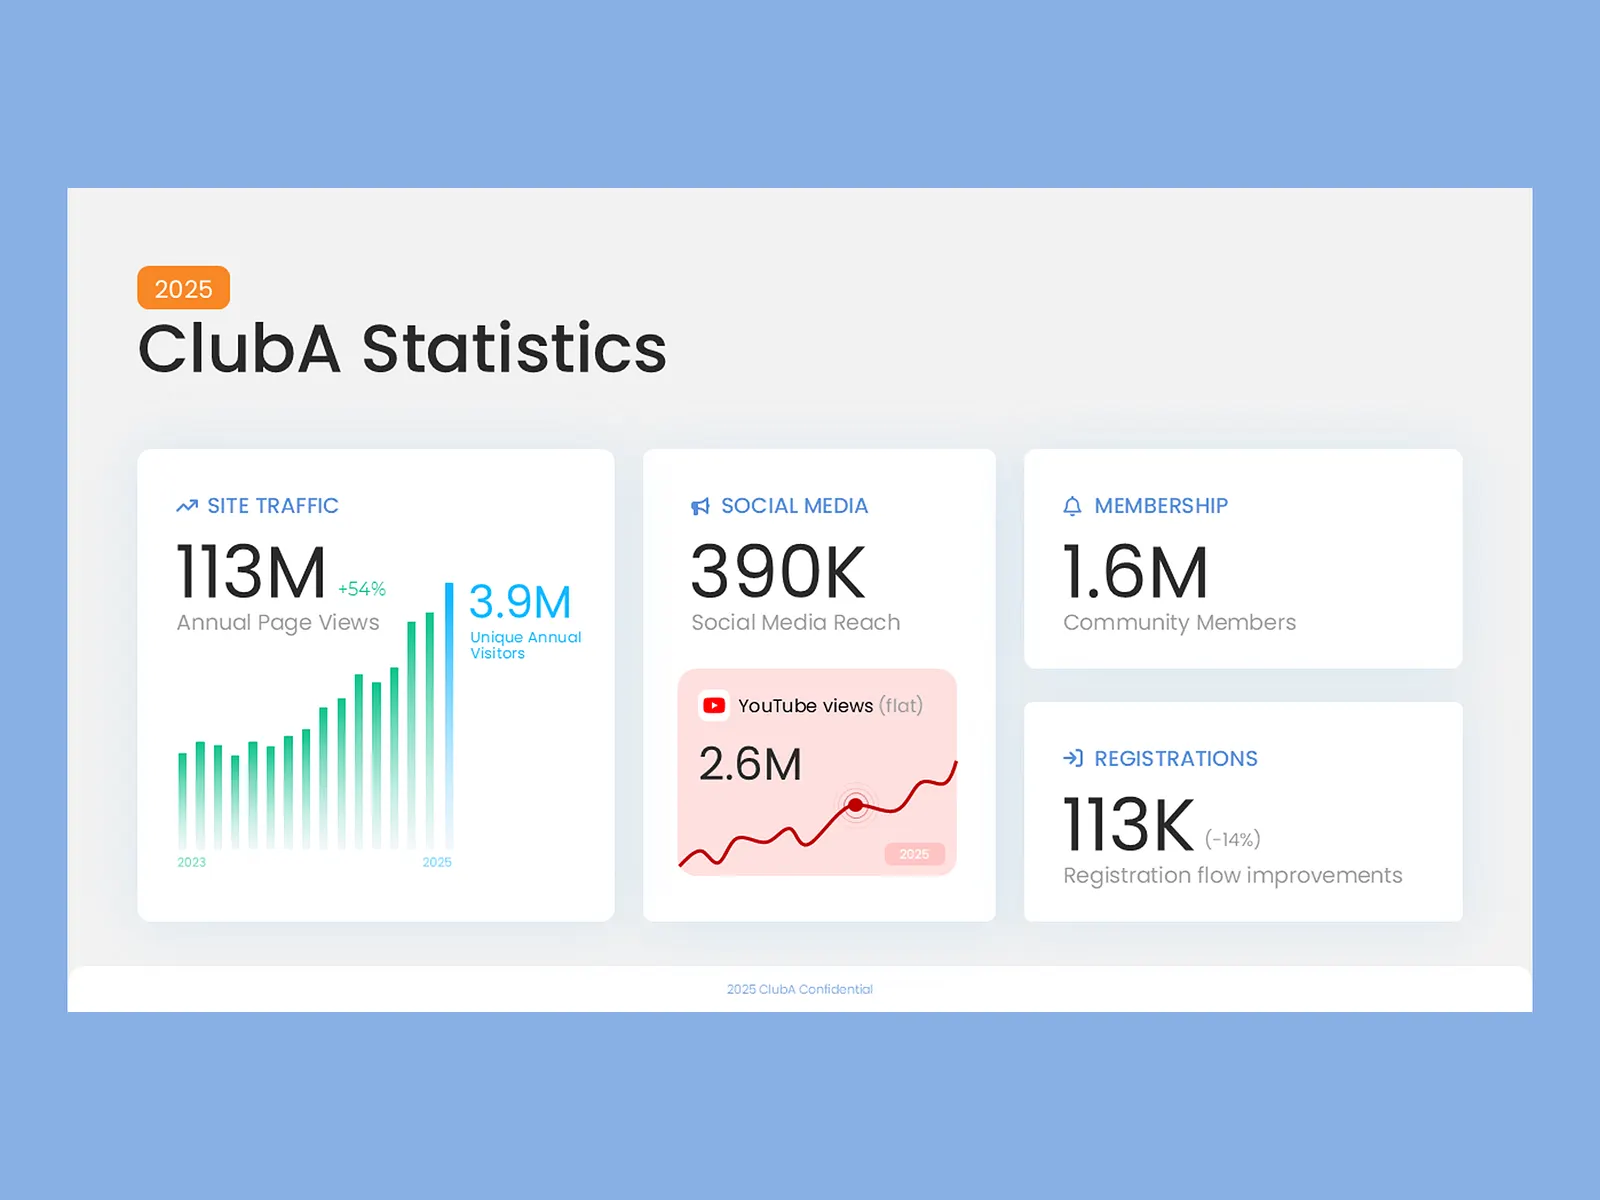
Presentation Design
Investor-ready stat slides
Goal: make community and traction statistics legible to investors in seconds.
 2 shots
Presentation Design
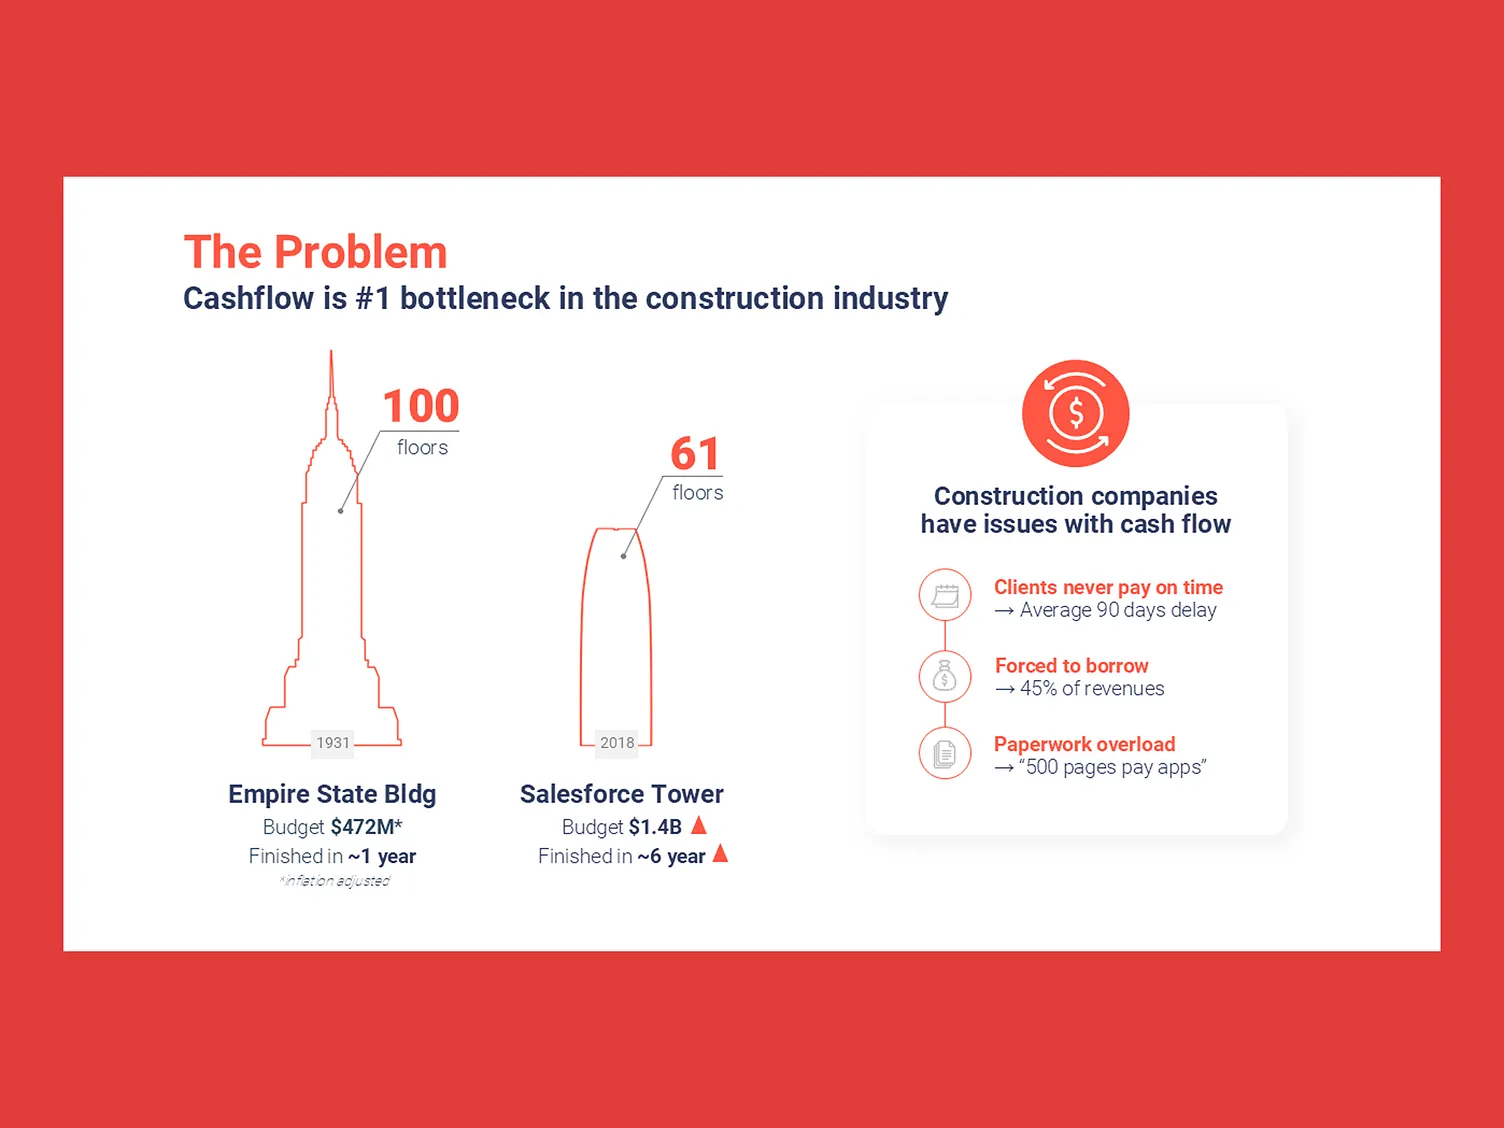
2 narrative visuals
Goal: turn abstract industry pain into visuals a jury remembers.
 2 shots
Presentation Design
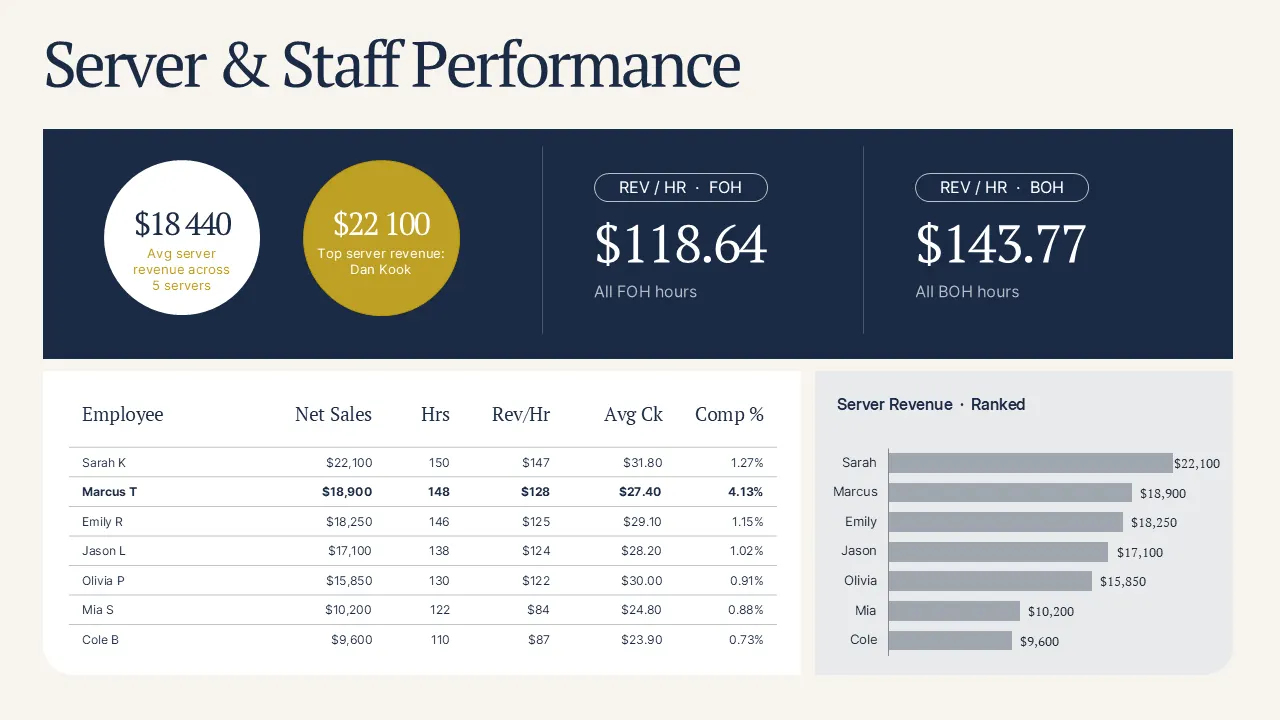
Ranked review-ready slides
Goal: give managers a single slide that anchors performance reviews.
Data Analysis
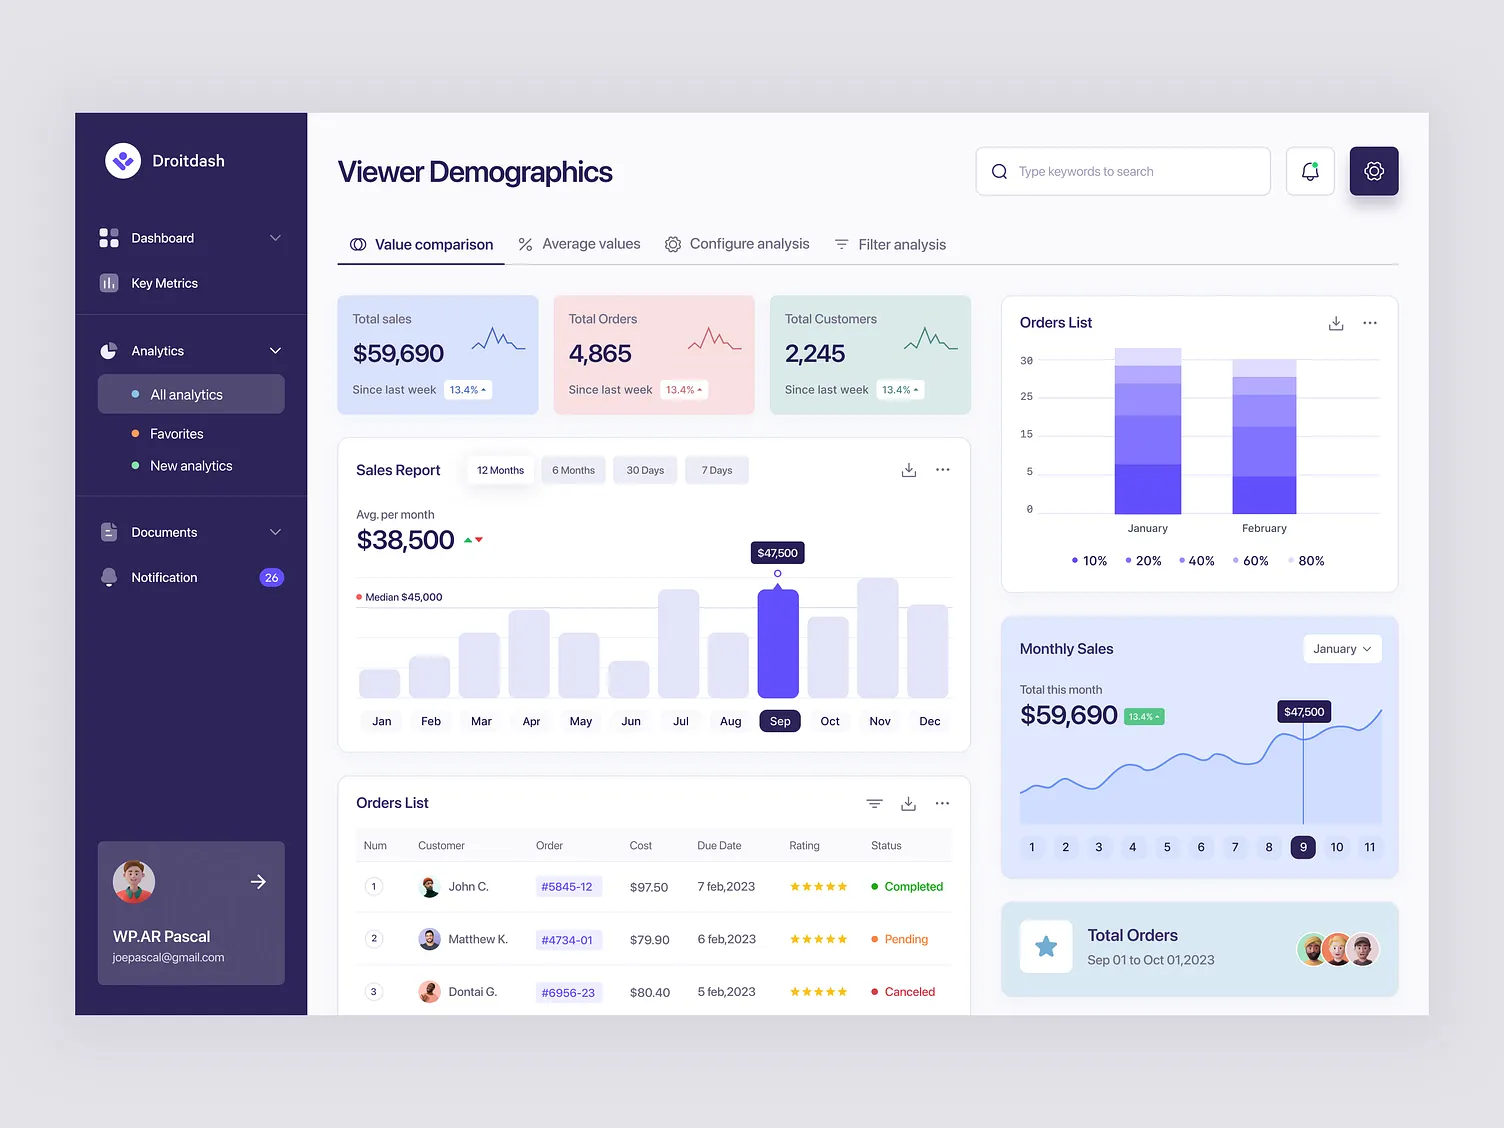
KPIs plus monthly trends
Question: which months and segments drive sales, and where do orders stall?
Business Analysis
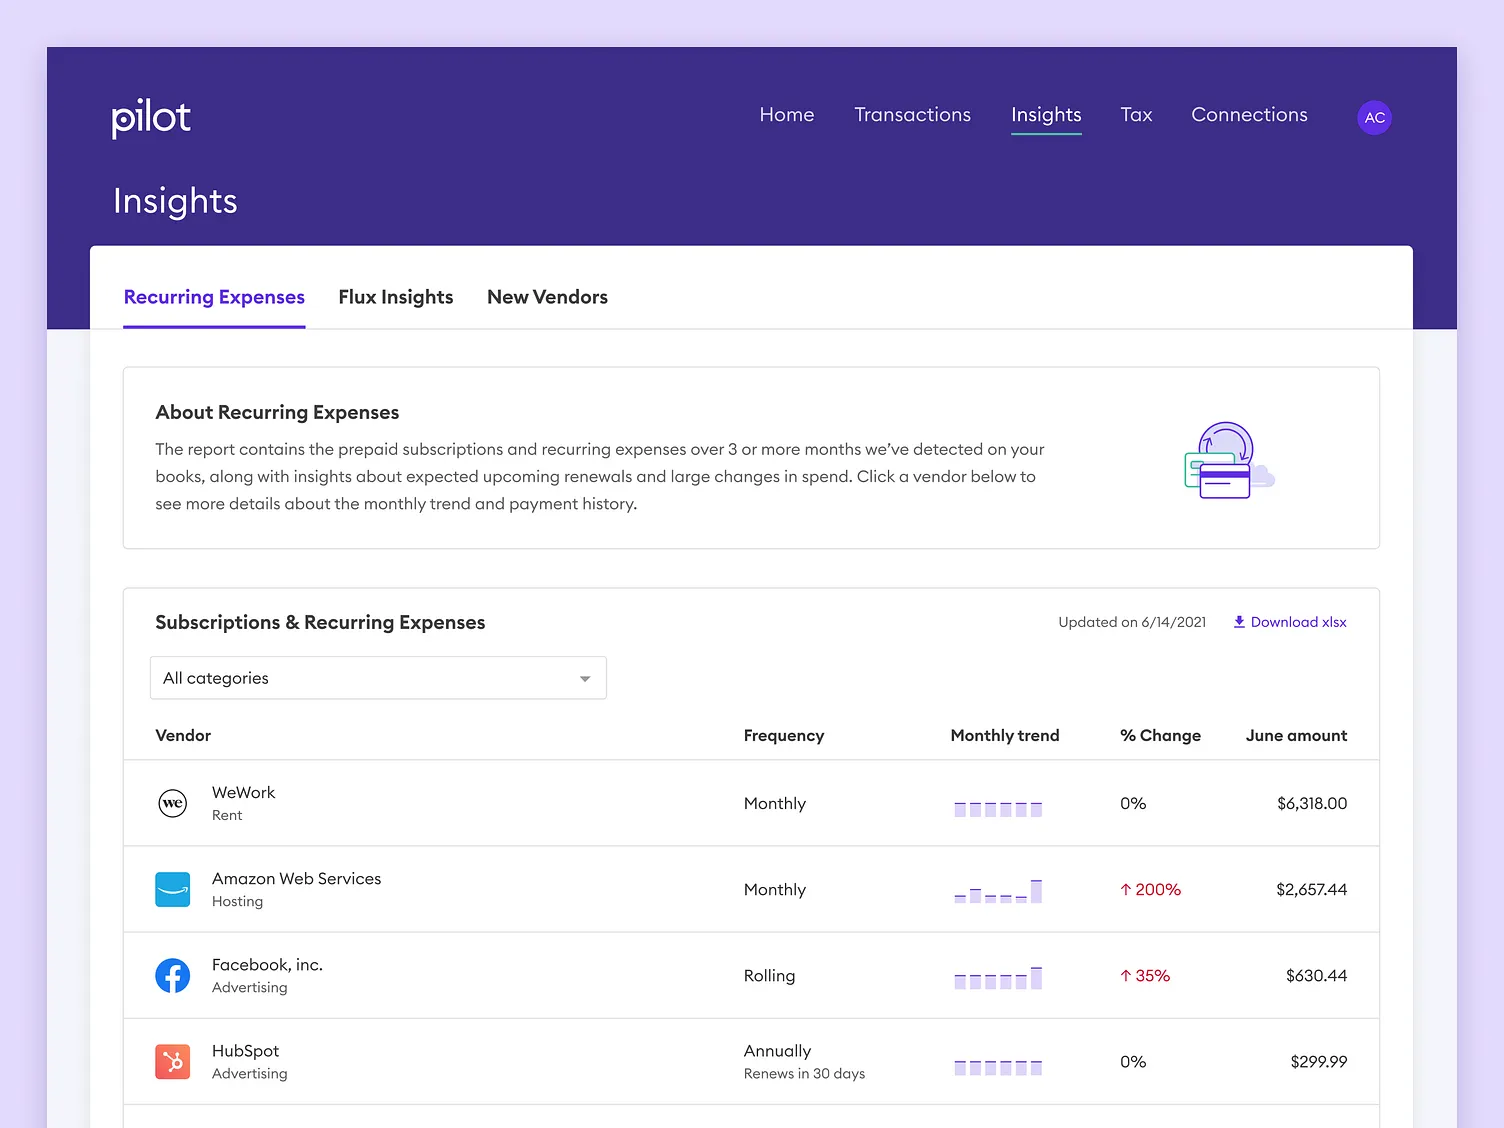
Spend story in one page
Goal: show finance leads what renews, what changed, and what to do.
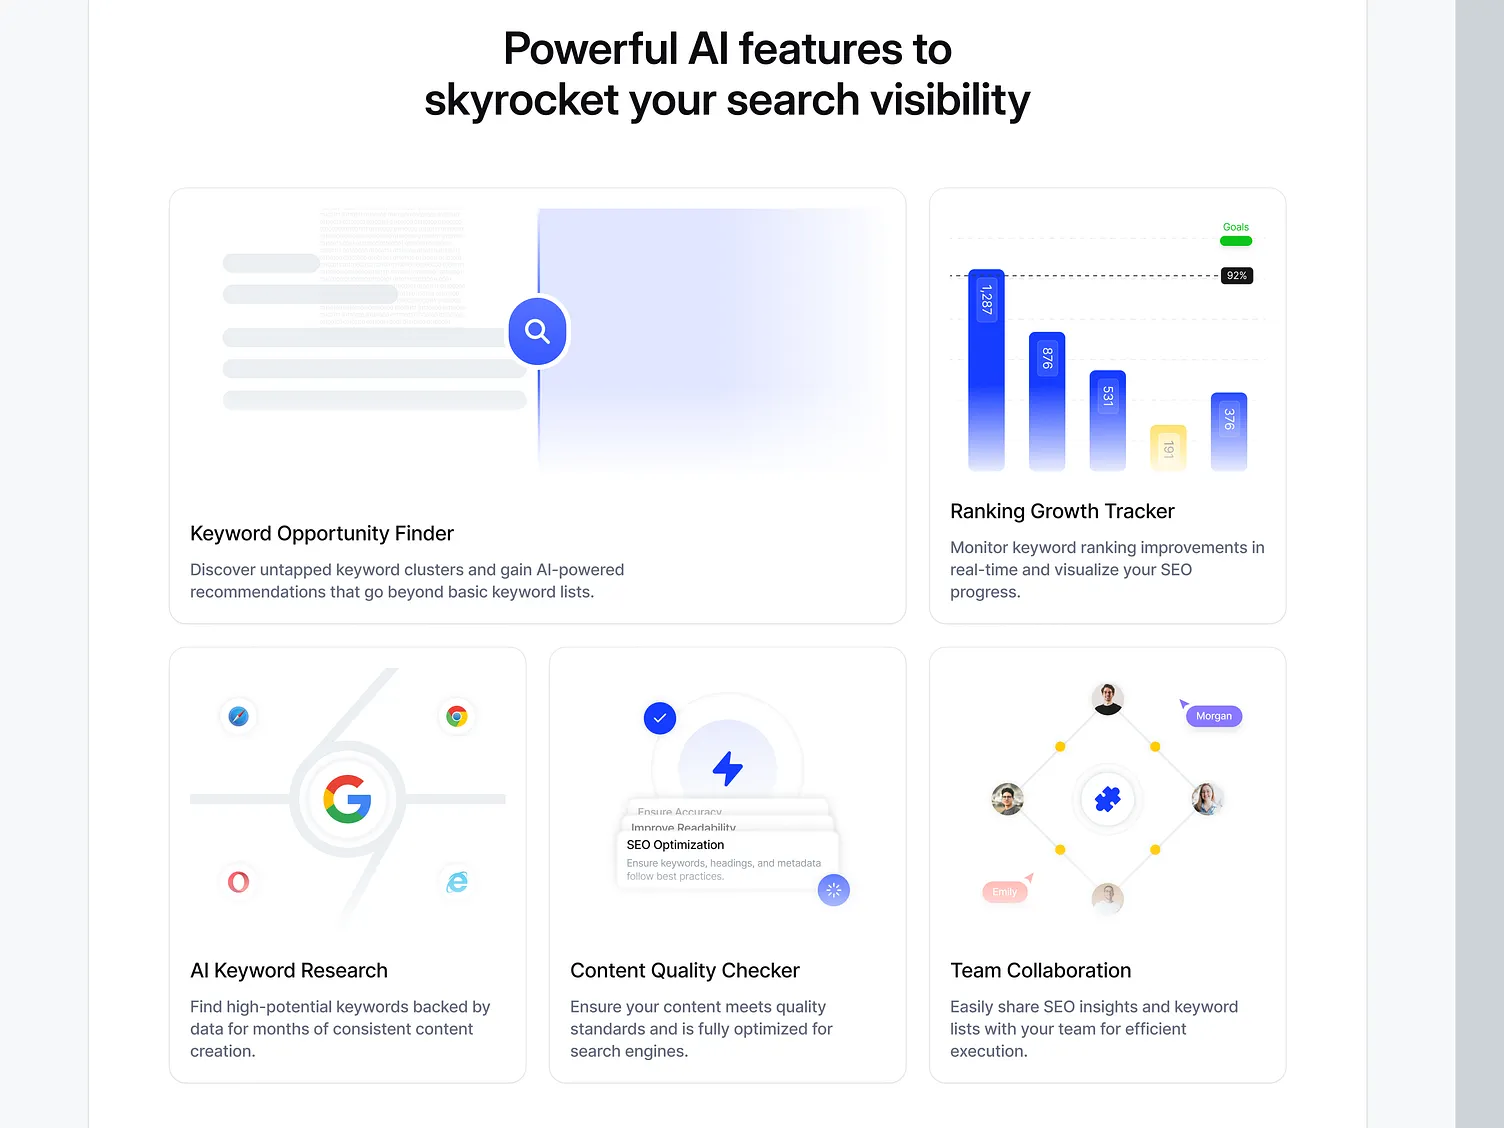
SEO & Content
Feature story plus FAQ
Goal: convert search-driven visitors with feature-led content.
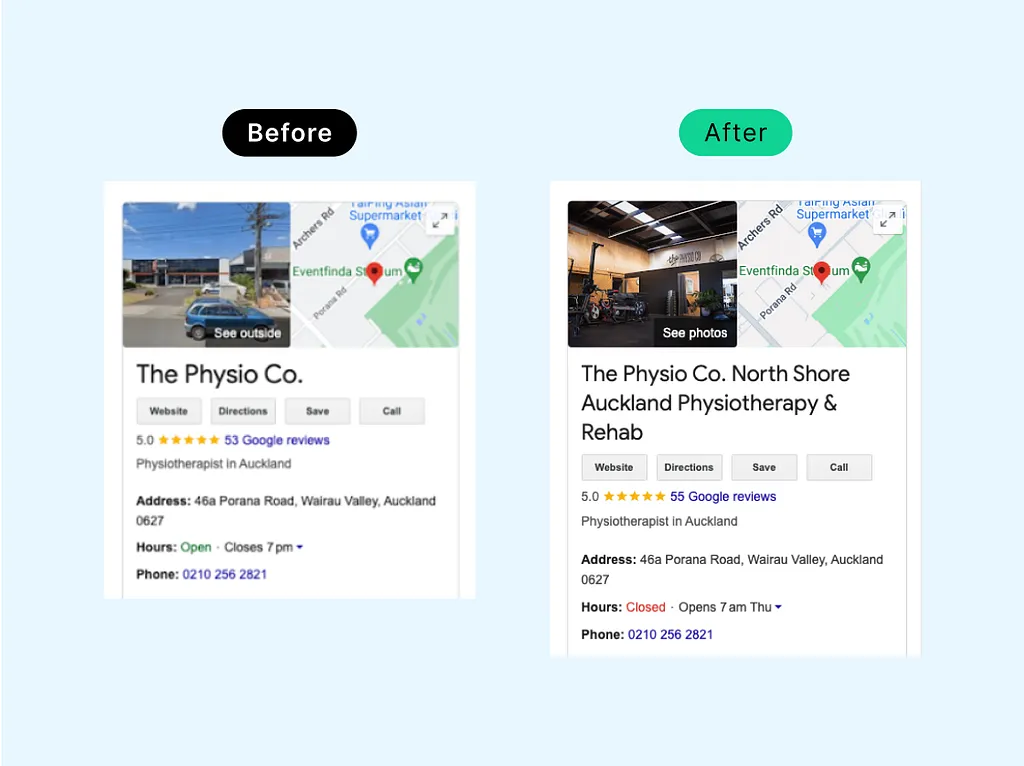 2 shots
SEO & Content
Profile plus site, before to after
Goal: rank for physio + suburb queries and convert profile views into bookings.
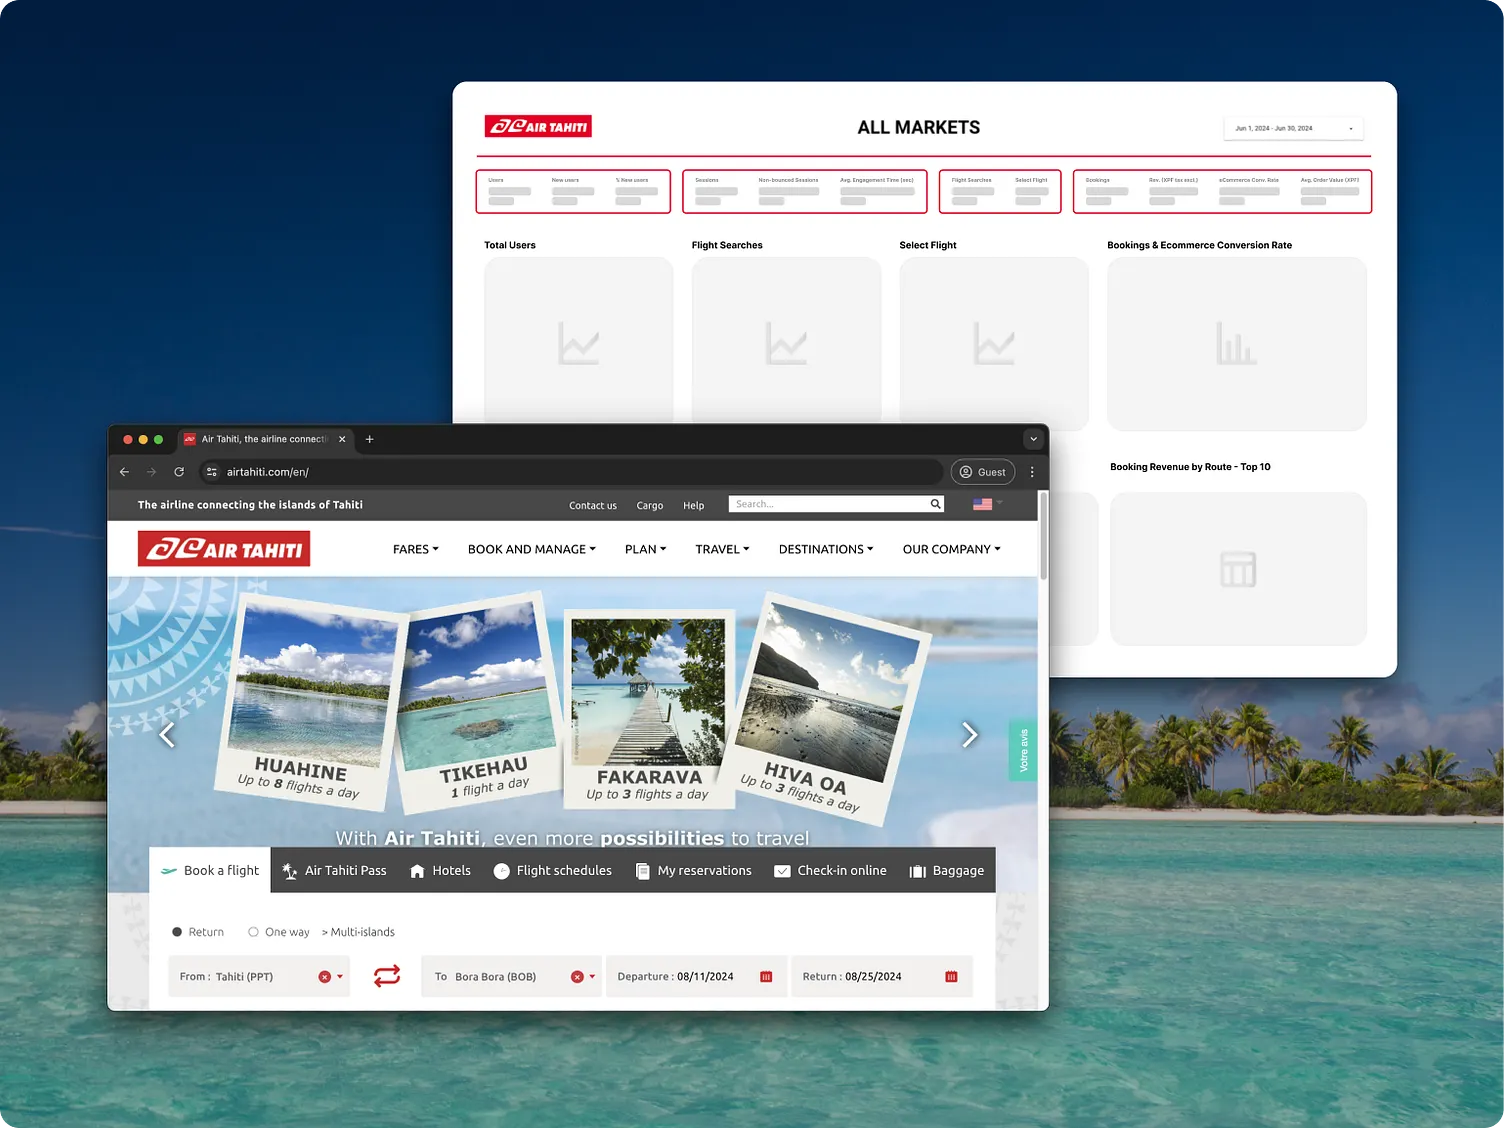 2 shots
SEO & Content
GA4 plus GTM plus Looker
Goal: see which markets, devices, and sources turn searches into bookings.
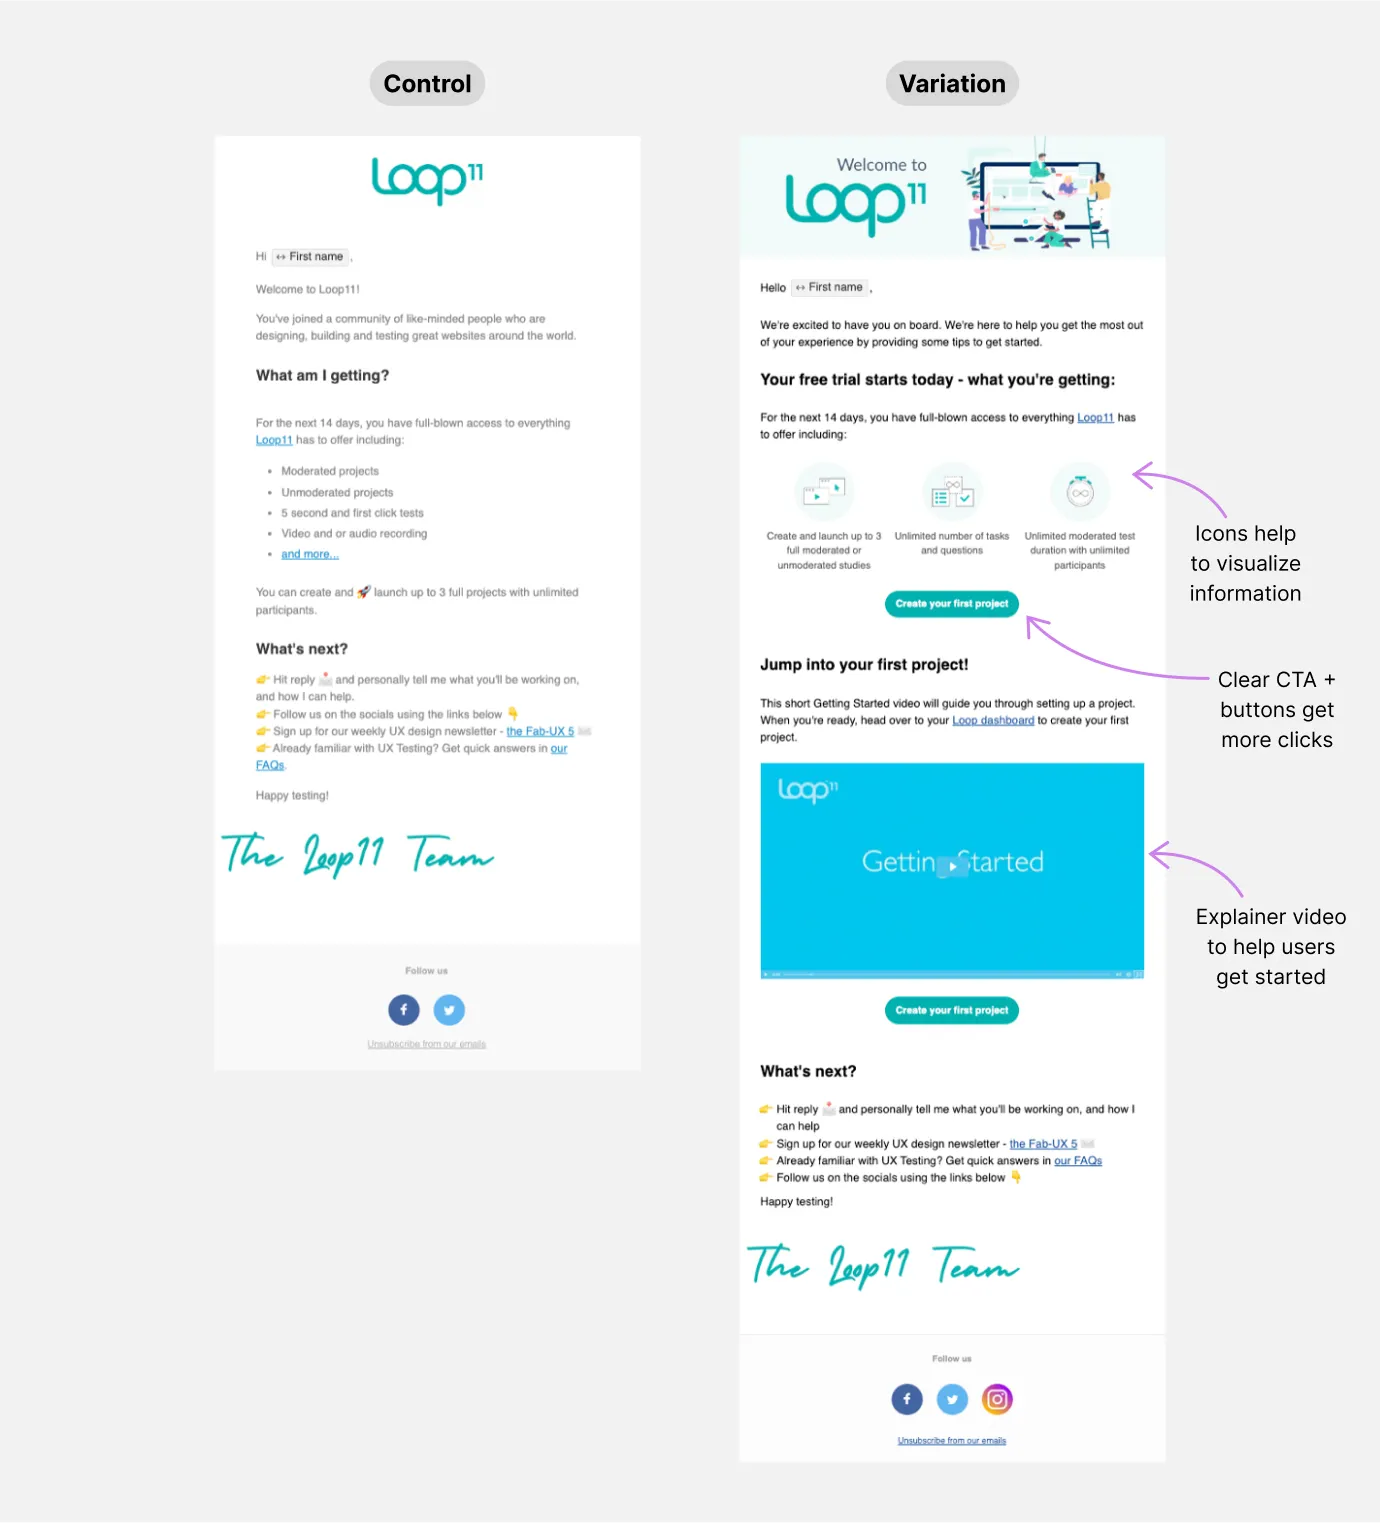 2 shots
SEO & Content
Control vs variation uplift
Goal: lift first-project creation from the welcome email.
 2 shots
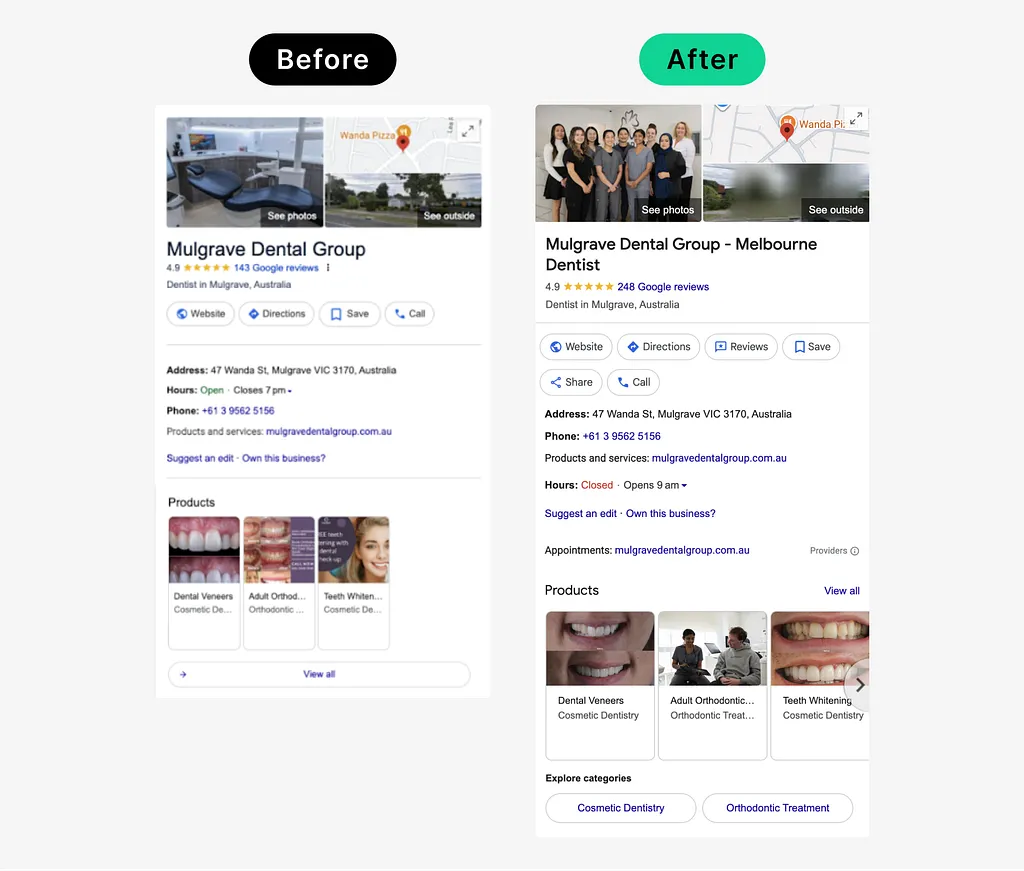
SEO & Content
143 to 248 reviews
Goal: dominate dentist + suburb searches and grow review velocity.
Video Editing
60-sec product tour
Goal: let viewers grasp the site's value without visiting it.
Video Editing
2 release cuts
Goal: ship release notes people actually watch.
Process
01
Goal, audience, deadline, files. You get a fixed quote back.
02
Outline or early analysis first. You approve the direction before polish.
03
Charts checked, copy tightened, master slides built.
04
Source files, a short walkthrough video, and next steps.
Confidentiality and legality: licensed fonts, stock, and data sources only. Academic integrity respected, with guidance and editing, never ghostwritten submissions.