Presentation Design
Infographic problem slides that land
2 narrative visuals
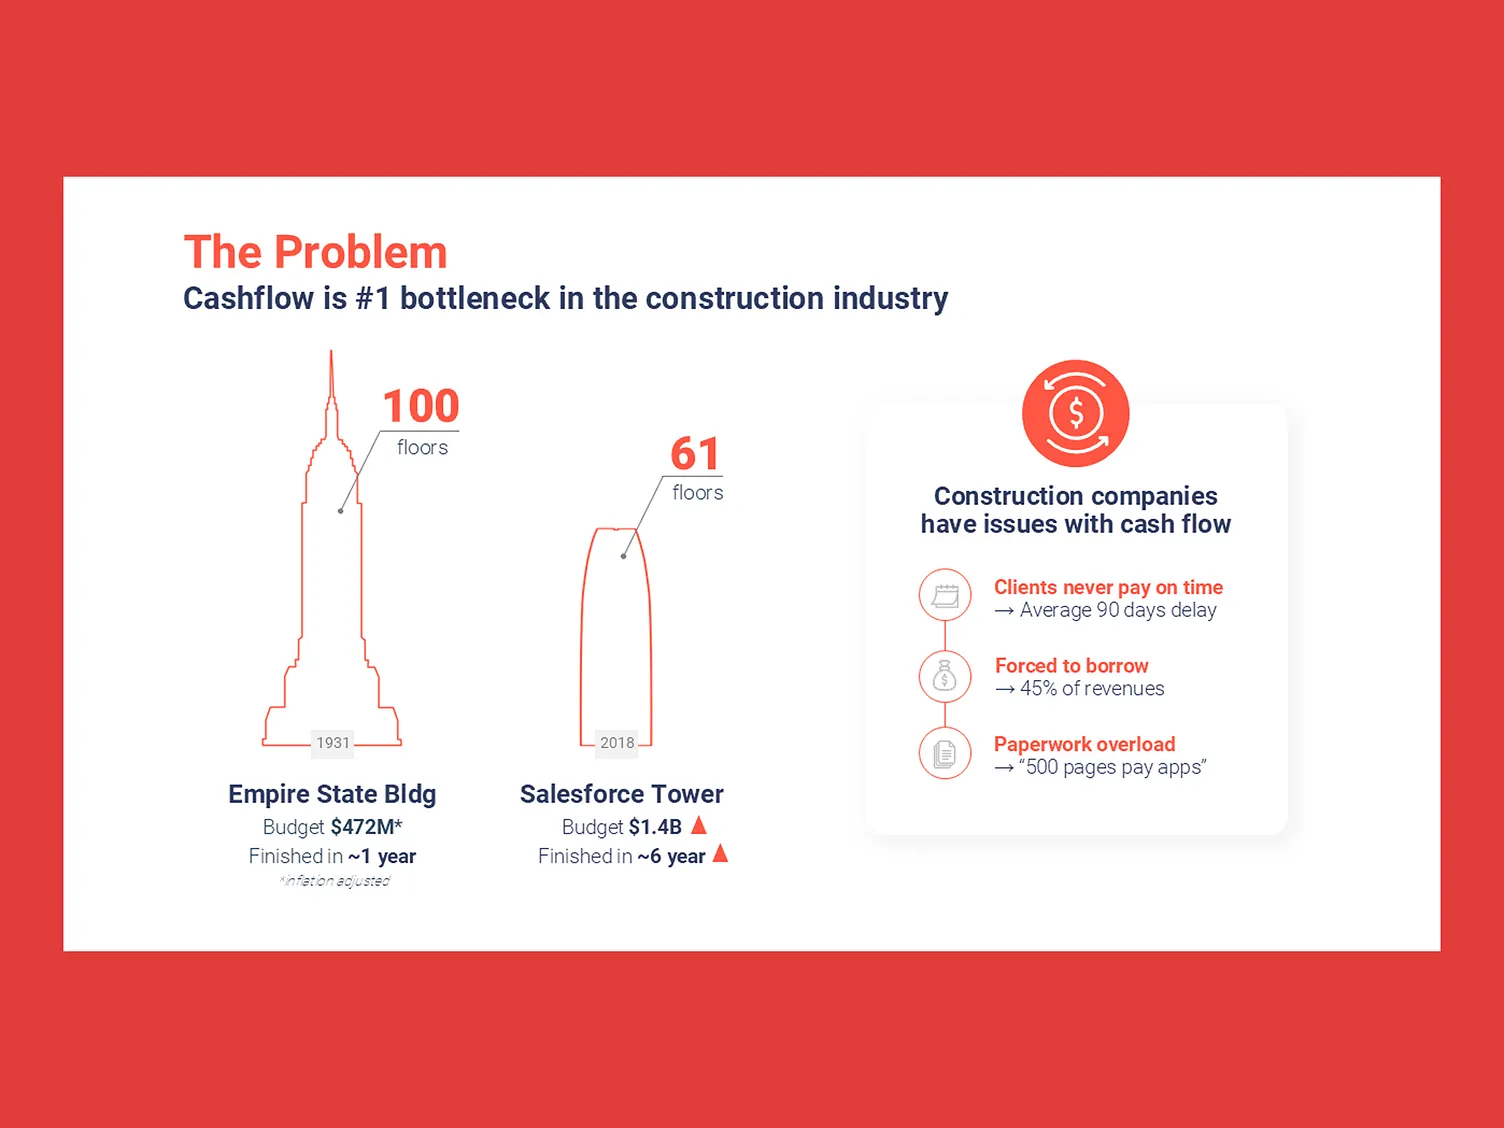
Problem-framing infographics: a construction cash-flow comparison and a reputational-cost map, designed to make the pain impossible to skim past.
1 / 2
The brief
- Goal: turn abstract industry pain into visuals a jury remembers.
- Deliverables: two infographic slides with a shared type and color system.
- Constraint: each slide must work standalone when forwarded as an image.
Method
01
Narrative
Picked one contrast per slide: then vs now, cause vs cost.
02
Diagram
Built custom line illustrations and petal maps instead of stock icons.
03
Type
Tight headline hierarchy with annotated callouts for key figures.
04
System
Shared palette and numbering so both slides feel like one deck.
Findings
- Empire State vs Salesforce Tower contrast makes the bottleneck tangible.
- Five-point reputational map gives speakers a natural talk track.
- Both slides export cleanly as standalone share images.
Stack
PowerPointInfographicsSlide system
Next steps
- Build the matching solution and traction slides.
- Add speaker notes with the 30-second talk track.
- Package the diagram styles as masters.