Presentation Design
Analytics dashboard slide collection
4 dashboard slides
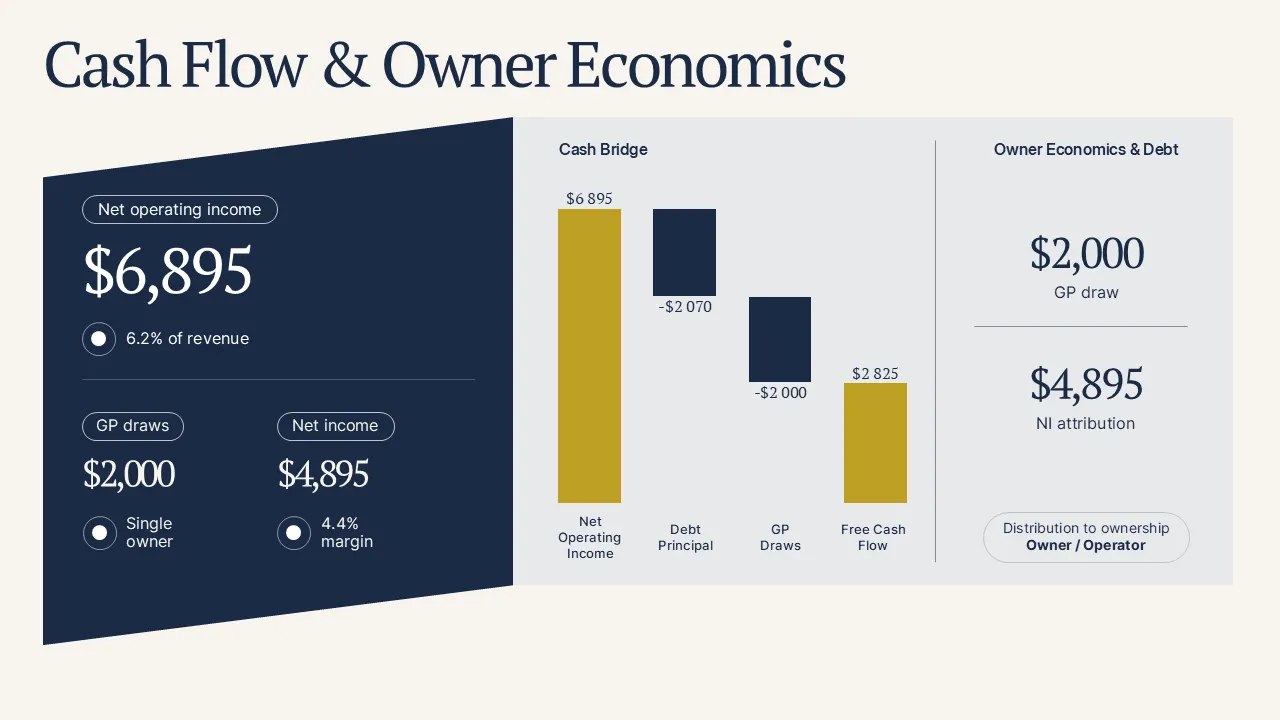
A cohesive set of analytics dashboard slides — cash bridge, cost breakdown, and menu engineering — in one navy-and-gold system that stays readable at a glance.
1 / 3
The brief
- Goal: present operational analytics to non-finance stakeholders without wall-of-numbers fatigue.
- Deliverables: four dashboard slides with one shared visual language.
- Constraint: tables and charts must stay legible when printed in grayscale.
Method
01
Structure
Split each slide into hero number, visual proof, and ranked detail.
02
Charts
Waterfall, bar-split, and quadrant plots matched to each question.
03
Tables
Status columns (Watch / OK / Monitor) so rows scan in seconds.
04
System
One palette, one number format, one footer treatment across all four.
Findings
- Cash bridge reads net income to free cash flow in four bars.
- Menu-engineering quadrant separates stars from dogs at a glance.
- Alcohol cost detail pairs category bars with a sortable table.
Stack
PowerPointDashboard slidesData tables
Next steps
- Add quarter-over-quarter comparison variants.
- Build the appendix with metric definitions.
- Hand over the color and number-format cheat sheet.