Data Analysis
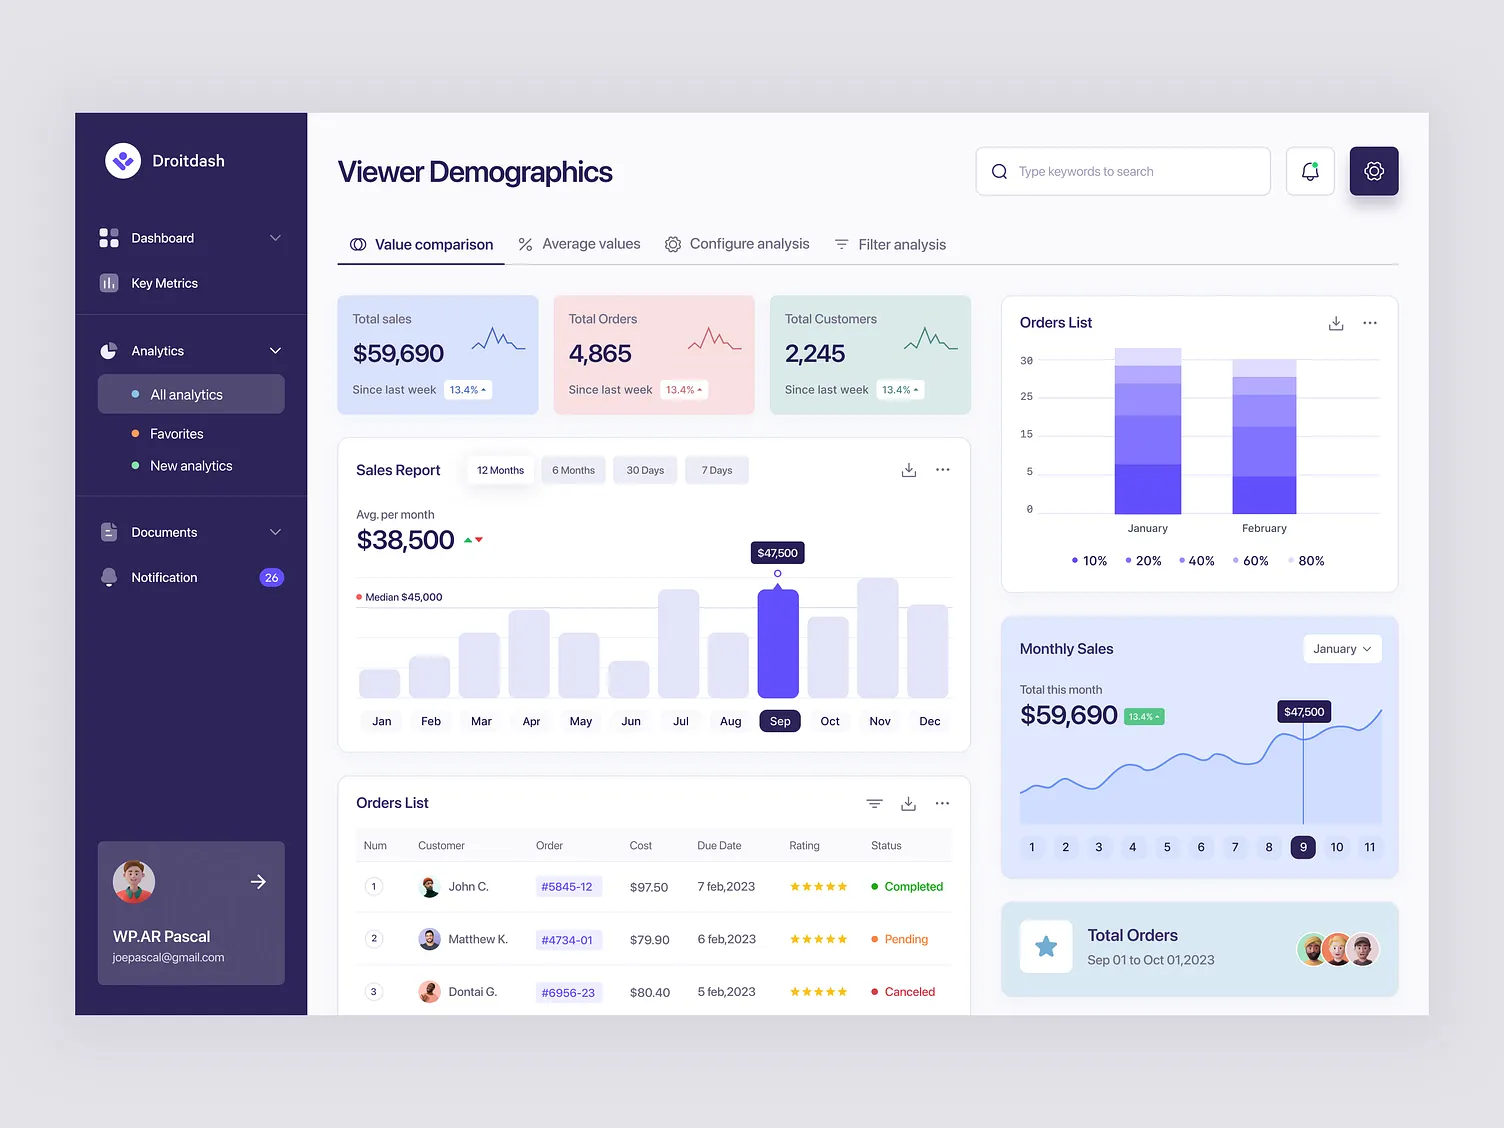
Sales and viewer analytics dashboard
KPIs plus monthly trends
An analytics dashboard surfacing total sales, orders, and customers with monthly trends and an orders ledger — designed for weekly reviews.
The brief
- Question: which months and segments drive sales, and where do orders stall?
- Audience: operators who need the week-over-week story in one screen.
- Scope: KPI cards, sales report, orders list, and monthly trend views.
Method
01
Collect
Consolidated orders, customers, and monthly sales into one model.
02
KPI
Defined total sales, orders, and customers with since-last-week deltas.
03
Trend
Built monthly sales bars and daily trend lines with median markers.
04
Ledger
Added an orders list with status, ratings, and due dates.
Findings
- September peak of $47.5K flagged against a $45K median baseline.
- Pending and canceled orders surface directly in the ledger.
- Month selector keeps total-orders context next to the trend.
Stack
Dashboard designKPI cardsTrend analysis
Next steps
- Wire the dashboard to live order data.
- Add cohort and retention views.
- Set up weekly snapshot exports for the team.